Reading River Levels: Fishing by the Gauge
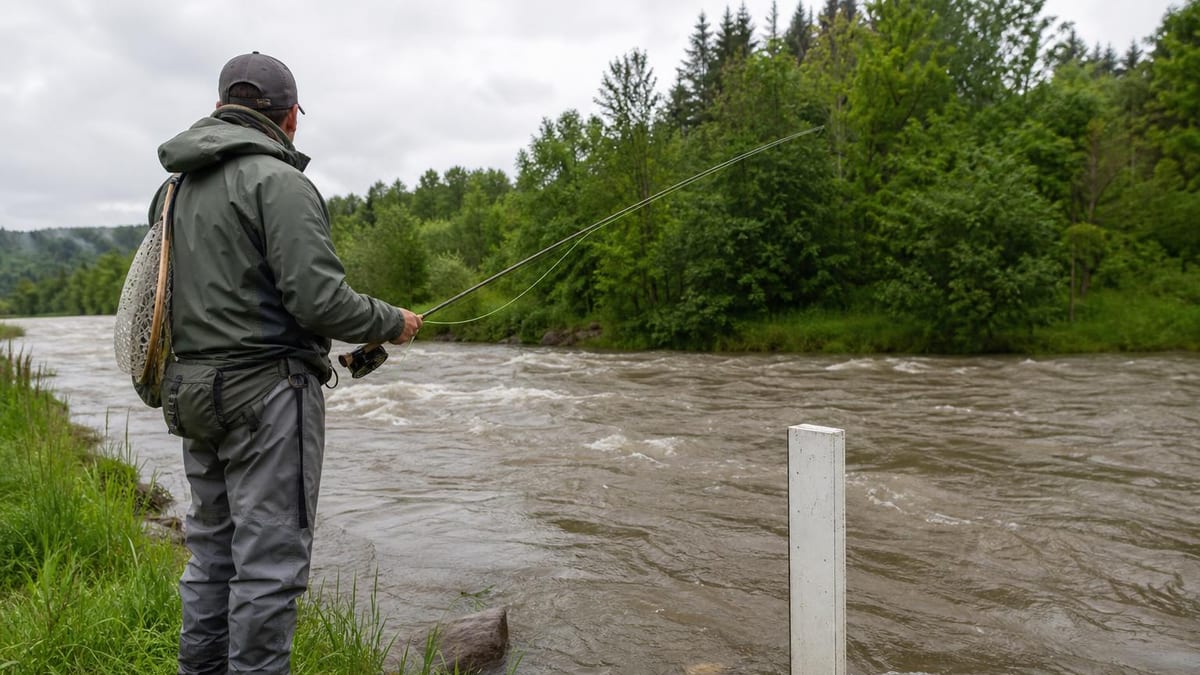
River gauges answer the question that decides a river day before you leave the house: how much water is moving, and which way is it trending? USGS operates more than 13,500 streamgages reporting stage (water height) and discharge (flow in cubic feet per second), updated as often as every 15 minutes. Anglers read them for the trend — rising, falling or stable — and for safety against the National Weather Service's flood stages.
Key takeaways
- Stage is the water's height above an arbitrary zero; discharge (cfs) is how much water is moving. Discharge is the number that compares across rivers.
- USGS runs more than 13,500 streamgages, recording typically every 15 minutes with data transmitted every 1 to 4 hours — recreation is a stated use.
- Base flow is groundwater seepage — the river's dry-weather level. Storm flow rides on top of it and drains off; the gauge shows you which one you're looking at.
- West Virginia's DNR tells anglers directly: check gauges upstream of where you plan to fish — steep rises upstream mean rising water coming to you.
- NWS defines action, minor, moderate and major flood stages per gauge — above action stage, monitoring stops being optional.
- There is no universal 'best cfs' — learn your river's numbers by logging what its gauge read on the days it fished well.
The river tells you its condition before you leave home
Every river day is decided by a number most anglers never check, and the government publishes it in near real time. The US Geological Survey operates more than 13,500 streamgages nationwide — listing recreational safety among their stated purposes — each recording the river typically every 15 minutes and transmitting by satellite every one to four hours. Before you commit to a two-hour drive, the river has already filed a report.
Reading that report takes two definitions and one habit. The definitions are stage and discharge; the habit is looking at the trend line instead of a single number. Everything else in river-condition reading builds on those.
Stage, discharge, and which number to trust
Stage — gauge height — is simply the water surface’s height in feet above an established zero, and USGS notes that zero is arbitrary, often set near the streambed. That makes stage a local dialect: four feet on one river is a trickle, on another a flood. It’s useful once you know a specific water, and meaningless for comparing rivers.
Discharge is the universal language: the volume moving downstream per unit time, in cubic feet per second. USGS states plainly that most users of streamgage data are interested in discharge — and the two numbers are joined by a rating, the measured relationship at each gauge that converts a continuous record of height into a continuous record of flow. When someone says a river “fishes best around 300 cfs,” they’re speaking discharge; when a local says “it’s good at two and a half feet on the gauge,” that’s stage. Both are the same river read through the same instrument.
One more phrase completes the vocabulary: base flow. USGS describes it as groundwater seeping into the stream — the water that keeps rivers alive through drought. Everything above base flow is weather passing through. The agency’s Peachtree Creek example makes it concrete: after a storm the creek fell back to a two-foot stage, and after a further month without rain it read 1.9 — that near-flat line is the groundwater talking. A gauge reading near base flow means a stable, settled river; a reading far above it means you’re looking at a storm still draining, with everything runoff changes — clarity, temperature, oxygen — in play.
Reading the trend, and borrowing tomorrow’s news
A single reading is a photograph; the hydrograph is the film, and the film is what fishes. Rising, falling or stable tells you more than high or low. A river stable at a modest level has had time to clear and settle. A river falling after a spike is improving by the hour — often the best window, as fresh food has washed in and visibility is returning. A river rising is a river changing under your feet, and the direction of change matters more than the current number.
The trick that separates gauge-readers from gauge-checkers comes straight from a state agency. West Virginia’s DNR encourages anglers and boaters to check levels frequently — and specifically to check gauges upstream of where you plan to fish, because steep increases upstream indicate quickly rising water headed your way. Rivers telegraph their intentions; the upstream gauge is the telegram. Many gauges also report extras — WVDNR notes water temperature among them — which stacks neatly with what temperature does to fish on its own.
There is deliberately no “best cfs for fishing” table here, because no agency publishes one and any number would be a guess dressed as advice. Flows fish differently per river, per species, per season. The gauge’s gift is calibration: log the reading on days the river treats you well, and within a season you own a table no website could have written — your river’s numbers, from trout water to a smallmouth river’s summer pools.
The safety ceiling is defined per gauge
Above a certain point, gauge-reading stops being tactics and becomes safety, and the National Weather Service has already drawn the lines — individually, for each gauge location. Action stage is where a rising river warrants mitigation and, in the agency’s words, gauge data should be closely monitored by anyone affected. Above it sit minor, moderate and major flood stages: minor meaning minimal property damage but possible public threat, moderate bringing inundation of structures and roads near the stream, major meaning extensive inundation and evacuations. Because the stages are set per location, the number that matters is your gauge’s — look it up once and you’ll know it forever.
Under all of it sits the physics the NWS repeats every flood season: six inches of fast-moving water can knock over an adult, twelve can carry off a car. A wading angler is a person standing in the hazard the flood stages describe. When the gauge is above action stage, or an upstream gauge is spiking toward you, the river has answered the day’s question — and the answer is the stillwater alternative, which is what makes the angler who reads gauges different from the one who reads the sky: the river never surprises them twice.
Frequently asked questions
What is the difference between gauge height and cfs?
Gauge height — stage — is the water surface's height in feet above an arbitrary zero point near the streambed, so it only means something on its own river. Discharge is the volume moving past per second, in cubic feet per second, and USGS notes most users really want this number. The two are linked: agencies maintain a stage-to-discharge rating for each gauge, which is how a continuous height record becomes a continuous flow record.
How current is the gauge data I see online?
Fresher than most anglers assume. USGS streamgages typically record stage every 15 minutes — as often as every 5 during rapid rises — and transmit by satellite to USGS servers every 1 to 4 hours. The reading you check with coffee in hand is usually within an hour or two of reality, with the standard caveat that real-time data is provisional and subject to revision.
What river level is best for fishing?
No agency publishes one, and the honest answer is that it's river-specific and species-specific. What a gauge gives you instead is the trend and the context: is the river at its groundwater-fed base flow, riding a storm spike, or draining back down? The productive habit is calibration — note the gauge reading on your good days, and over a season you'll know your water's numbers better than any table could tell you.
How do I know if a river is too high to fish safely?
Check the gauge against its own flood stages, because they're defined per location. The National Weather Service sets an action stage — where a rising river warrants mitigation and, in its words, gauge data should be closely monitored — then minor, moderate and major flood stages above it. Add the agency's blunt physics: six inches of fast-moving water can knock over an adult. Rising water plus an upstream storm is a day to fish somewhere else.
Why check gauges upstream of where I fish?
Because rivers deliver their news downstream with a lag. West Virginia's DNR spells out the tactic for anglers and boaters: checking gauges upstream of where you plan to fish can alert you to changing water levels before they reach you — steep increases upstream mean quickly rising water is on its way. One glance at two gauges tells you not just what the river is doing, but what it's about to do.
Sources
- How Streamflow is Measured — US Geological Survey, Water Science School. Accessed August 11, 2026.
- Streamgaging Basics — US Geological Survey, Water Resources. Accessed August 11, 2026.
- Base Flow in Rivers — US Geological Survey, Water Science School. Accessed August 11, 2026.
- Hydrologic terminology (flood stages) — NOAA National Weather Service. Accessed August 11, 2026.
- Turn Around Don't Drown — flood safety — NOAA National Weather Service. Accessed August 11, 2026.
- Stream Gauges for Anglers and Boaters — West Virginia Division of Natural Resources. Accessed August 11, 2026.
How we choose sources: sources policy.
More in this series
One condition rarely acts alone. BiteScore reads them together.
Fishing Club AI combines live weather, marine conditions and moon data into a simple bite forecast for your exact spot.
Get the App