Can AI Find Fishing Spots?
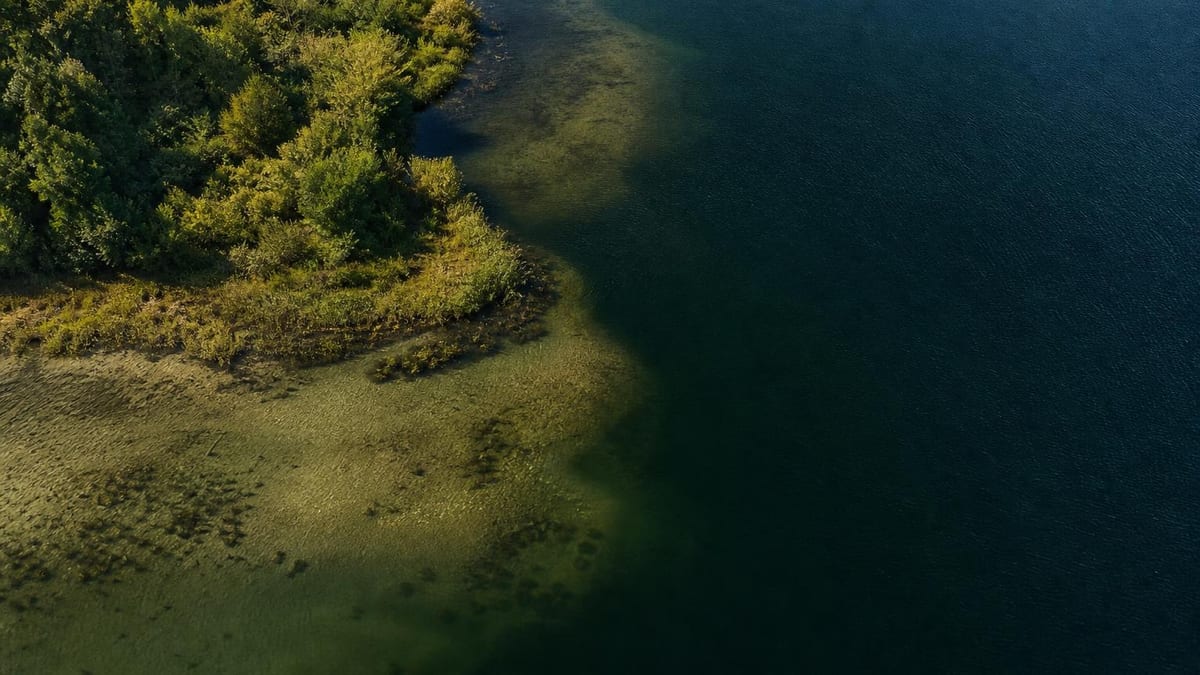
AI can grade water — depth, structure, temperature, habitat type — and rank places where a species could plausibly be. That is genuinely useful for choosing where to start. What no model can confirm is presence today, legal access, a closure issued this week, or how hard the spot was fished yesterday. A habitat score is a hypothesis about a place, not a report of a fish.
Key takeaways
- Fisheries science builds species distribution models that predict habitat associations — not where fish are right now.
- A systematic review found models with good accuracy still produced spatial predictions that varied substantially.
- Fish clustering in good habitat is exactly what breaks the link between catch rates and how many fish are there.
- Crowd-sourced spot data skews: anglers under-report blanks and deliberately keep good spots secret.
- Stocking schedules and emergency closures are published per water and change without notice.
What a spot model actually predicts
The science behind ranking water is real, and it answers a narrower question than “where are the fish”. Fisheries researchers build species distribution models that relate where a species has been recorded to measurable properties of place — depth, temperature, substrate, habitat type — and then score other water by the same properties.
The output is a habitat association. A systematic review of marine fish distribution modelling describes the inputs plainly: the data may be of coarse resolution, or may only be a proxy of fish location. A high score says a place looks like the places this species uses. It does not say the species is there this morning.
The same review carries the finding worth keeping. Models built from different predictor sets maintained good accuracy, but their spatial predictions varied substantially. Two defensible models, two different maps. When an app paints one confident heat map over your lake, it has quietly chosen one of many.
Federal habitat tools are careful about this in a way consumer maps rarely are. NOAA’s Essential Fish Habitat mapper describes itself as a tool for viewing important habitats — where managed species spawn, grow or live — and its definition of essential fish habitat is a category of place: wetlands, coral reefs, seagrasses, rivers. Nowhere does it claim to locate fish.
The clustering trap
Here is the twist in using habitat to find fish: the fact that it works is also what makes it misleading.
A whole-ecosystem experiment demonstrated the mechanism. Ordinary, non-spawning habitat preferences created loose aggregations that anglers could target, and that alone was enough to make catch rates hyperstable — catch stayed high while the underlying population changed. The authors note that habitat preferences are common to nearly all fishes and widely known to anglers, so this pattern should be expected broadly.
A steelhead study put numbers on the illusion: when abundance declined by 50%, catch rate declined by only 40%, overestimating the remaining fish by 28%. The fish were fewer; the good spots still produced.
For an angler this cuts two ways. Yes, structure and habitat concentrate fish, which is why spot-ranking works at all — our own spots feature leans on exactly that. But a spot that keeps producing is not proof the water is healthy, and a model trained on catches inherits the same blind spot.
Why crowd maps skew
If models cannot see everything, can the crowd fill the gap? The research on angler-app data says the crowd sees selectively.
The documented biases stack. Participation is non-random to begin with — smartphone ownership and who chooses to use apps shape the sample. Avidity bias means the keenest anglers contribute most. Trips that catch nothing tend not to get logged, so effort is understated and success overstated. Spatial coverage tilts toward popular, accessible, urbanised water.
And then there is the honest one: intentional errors or omissions driven by a desire for secrecy or prestige. Anglers hide their best water on purpose. A crowd-sourced map is therefore not a map of good spots — it is a map of spots people were willing to disclose, which is close to the opposite.
There is also a conservation reason to be glad precise spots stay fuzzy. Telemetry work on European sea bass found a 93% return rate to the same localised foraging areas year after year — 77% of fish returned to the exact receiver where they were previously recorded — and concluded the species is very susceptible to local depletion. Broadcasting an exact mark concentrates pressure precisely where fidelity makes it most damaging.
The facts that live only in local rules
Suppose the model is right and the fish are there. Three questions remain that no map model answers, and all three are published per water by agencies.
Whether you may fish it at all: access and private banks are local facts, and in-season closures move. Alaska’s emergency orders open and close seasons and areas, change bag limits and modify methods — and are explicit that they may be issued at any time and carry the same force and effect as law. Washington’s emergency rules override the printed pamphlet the same way.
What was stocked: Oregon publishes trout stocking by week, not date, and states the schedule is subject to change without notice — fish intended for one water get diverted to another when conditions are poor. Texas publishes per-water dates with the same warning attached.
These are not edge cases; they are often the whole story of why one water fishes well this week. Our local knowledge article covers the rest of what lives outside any feed.
How to use spot-ranking honestly
Treat a ranked spot as a shortlist entry, not a destination. The model has done the useful, boring work — filtered a big map down to water worth checking — and that is where its knowledge ends.
Then do the two checks the model cannot: your state agency’s page for that water (access, closures, stocking), and your own eyes when you arrive. Habitat scores age slowly; the things that decide today — a gate opened upstream, a bloom, six cars already in the pull-off — do not appear on any layer.
Our own map ranks nearby water by conditions and says exactly this on its feature page: a pin is a location, not permission, and not a promise of fish. That is not modesty for its own sake. It is what the evidence supports.
What it cannot do
- No model can confirm fish are present at a spot today. Habitat suitability is a probability about a place, not an observation of a fish.
- No model knows whether you may legally fish a spot — access, private banks and seasonal closures live in local rules, not in map data.
- It cannot see an emergency order issued this week. Alaska's are explicit that they may be issued at any time and carry the force of law.
- It cannot know what was stocked or when. Oregon's schedule states plainly that it is subject to change without notice.
- Crowd data cannot correct these gaps, because it has its own tilt — toward accessible water and away from kept secrets.
Frequently asked questions
Can AI actually find fishing spots?
It can rank water by how suitable the habitat looks, which narrows a map usefully. Fisheries science does the same thing at larger scale with species distribution models. What those models predict is where a species could live given depth, temperature and habitat — a systematic review of marine fish distribution modelling is explicit that inputs may only be a proxy of fish location. Presence today is a different question no map model answers.
How reliable are habitat suitability models?
Statistically decent and spatially inconsistent. The same review found that models built from different predictor sets maintained good accuracy while their spatial predictions varied substantially — meaning two well-scoring models can disagree about where on the map the good habitat actually is. That is worth remembering whenever a single map paints confident colours over water.
If fish concentrate in good habitat, doesn't that make spots predictable?
It does — and that same clustering is a known trap. A whole-ecosystem experiment showed that ordinary habitat preferences created aggregations anglers could target, which kept catch rates high even as abundance fell. A separate steelhead study quantified it: a 50% drop in abundance produced only a 40% drop in catch rate, an illusion of plenty. Predictable spots and healthy fisheries are not the same thing.
Are community-reported spot maps accurate?
They carry documented biases. Research on angler apps found the data prone to avidity bias, under-reporting of trips that caught nothing, spatial skew toward popular and urbanised areas, and intentional omissions driven by secrecy. The best spots are systematically the ones least likely to be shared.
What should I check that no app can tell me?
Three things, all from your state agency: whether access is public, whether an in-season closure or emergency order applies, and what has been stocked recently. Oregon publishes stocking by week with a change-without-notice caveat, Texas publishes per-water dates with the same warning, and Alaska's emergency orders open and close waters with the force of law. All of it is per water, current, and outside any model.
Related reading
Sources
- A systematic review of spatial habitat associations and modeling of marine fish distribution — Pickens et al., PLOS One (PMC8121303). Accessed August 8, 2026.
- Essential Fish Habitat Mapper — NOAA Fisheries. Accessed August 8, 2026.
- Experimental demonstration of catch hyperstability from habitat aggregation — Dassow et al., Canadian Journal of Fisheries and Aquatic Sciences 77:762-769. Accessed August 8, 2026.
- Hyperstability in an inland recreational steelhead fishery — Charbonneau et al., Transactions of the American Fisheries Society 154(4):339-351. Accessed August 8, 2026.
- Angler apps as a source of recreational fisheries data — Venturelli, Hyder & Skov, Fish and Fisheries. Accessed August 8, 2026.
- Trout Stocking Schedule — Oregon Department of Fish and Wildlife. Accessed August 8, 2026.
- Sport Fishing Emergency Orders — Alaska Department of Fish and Game. Accessed August 8, 2026.
- Site fidelity of European sea bass revealed by acoustic telemetry — Doyle et al., Scientific Reports 7:45841. Accessed August 8, 2026.
How we choose sources: sources policy.
More in this series
See the conditions for your own spot.
Fishing Club AI turns live weather, pressure and moon data into an hourly forecast — and shows you which factors moved the number.
Get the App